2.2 Roadmaps and OKRs
We have to empirically measure progress toward success. "Features delivered" is old hat. Create customer-facing value every single time by knowing what to measure and how to keep measuring.
Our definition of ready aligns us for success. It relies heavily on the outputs created in the previous activity on establishing product strategy:
Before starting
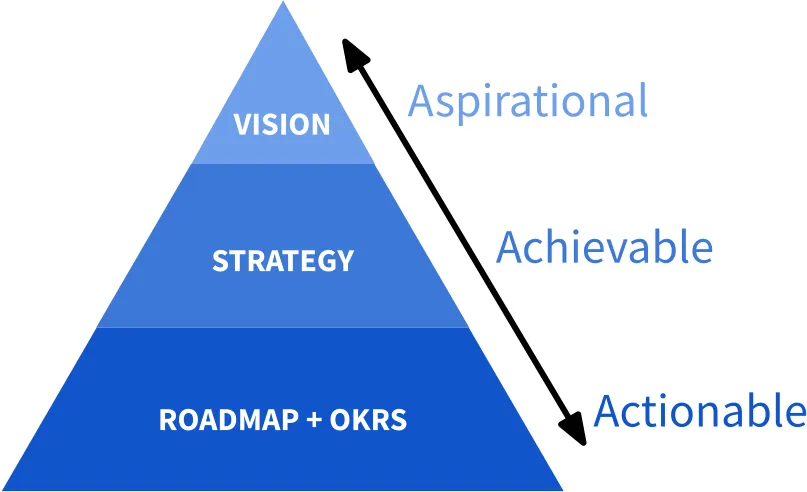
This activity turns the qualitative business objectives from 2.1 Product strategy into measurable outcomes. Without measurement, strategic objectives drift — you can’t tell if you’re succeeding, and there’s no way to course-correct. OKRs solve that by pairing each objective with one or more quantitative key results you can test continuously through delivery.
Guide to roadmaps and OKRs
OKRs (objectives and key results) are a framework to define, coordinate, and accomplish goals in a demonstrable way. Forbes defines them like this:1
- Objectives are specific and clearly defined goals that will have a major impact on the business. They should be challenging but attainable, and align with an organization’s strategic goals.
- Key results are how an objective’s progress is measured or monitored on the path to achieving the goal. Key results serve as outcomes that provide evidence of whether a goal has been reached or an objective has been accomplished.
A well-formed OKR reads: “We will [objective] as measured by [key result].” For example:
We will reduce our operational cost by 30% as measured by the month-over-month spend of our AWS infrastructure.
In this activity, we’ll refine our business objectives where necessary and create our key results, stated as measurable outcomes. We’ll use the combined objectives and key results as the foundation for our roadmap moving forward. Just keep in mind:
- Objectives are qualitative while key results must be measurable and quantitative.
- Roadmaps are short-term and focus on specific outcomes (not tasks).
You can have as many key results as needed to achieve an objective, but having more than five to seven probably indicates your objective is too broad. You might want to refine it — breaking it into several different objectives. If we create objectives that are too big, it becomes hard to prioritize and deliver manageable increments of the system.
What not to do (common mistakes)
Don’t mistake the actions taken to achieve an objective as the key result. For example, this is not a key result:
Objective: Reduce the number of data errors in the system. Key result: Install release 10.0 of the web site software.
On the other hand, these are well-stated key results:
Objective: Reduce the number of data errors in the system.
Key results:
- As measured by reducing the number of data quality errors reported to the support desk from 20 per day to no more than 1 per week,
- As measured by reducing the number of orders that cannot be fulfilled automatically to less than 1% of all orders in a given day,
- As measured by reducing the number of problems reported by customers trying to place an order to less than 3 per week.
The playbook protects value at every checkpoint
Clear OKRs do more than measure a single activity — they feed checkpoints and feedback loops threaded through every phase of the playbook. Major milestones constantly checkpoint your key results; we protect customer value by continuously re-injecting those results into the delivery pipeline and insisting that the only path forward is a positive measure of outcomes.
Matching objectives and key results
It’s important to find key results that are leading indicators of your objective, as opposed to lagging indicators. You want results that can be measured regularly and frequently, and lead to the overall objective. For example, if your objective is to improve recurring revenue (an annual outcome), you’ll likely want to measure quarterly revenue and subscriptions.
Our automated delivery pipeline means we need to set up metrics that can be measured automatically, in our delivery process. If you can’t measure it automatically on every build or every sprint, it’s probably the wrong key result.
Inputs
- Clear, concrete business objectives that encompass the current delivery iteration.
- The right people and team participation (e.g., Product Owner, business analyst, business domain experts, customer).
Process
The most effective way to establish measurable key objectives is to “look for the money.” Trace the objective down to its business driver — that driver almost always has specific monetary goals. An ROI Map that distills business objectives into revenue earned is the most reliable tool I’ve used for this.
The ROI Map below traces most business objectives (such as improving cost efficiency) to specific strategies (such as cost avoidance), along with a definition of what the measurement looks like:
| Strategy | # | Measurement | Description |
|---|---|---|---|
| Cost Efficiency | 1 | Cost avoided ($ benefit) | Cost avoided in $ over time (e.g., lower payments for infrastructure, SaaS, etc.) |
| 2 | Return on team | ROI from features over time / cost of team during definition period | |
| Speed to Business | 3 | Average lead time to change | Average time from backlog acceptance to customer delivery (based on key results attained) |
| Capability Performance | 4 | % time invested in high-value work | Reduction of non-value add work (manual process versus automation, rework, defect remediation) |
| 5 | Internal customer satisfaction | Satisfaction index based on internal customer surveys that reflect user satisfaction | |
| 6 | Data quality | Number of data quality blocking issues per region or month | |
| 7 | Data & regulatory compliance | % of data created or originated following governance standards, policies, procedures and controls | |
| 8 | Capability maturity | Maturity capability improved to a higher functional level or improved execution efficiencies | |
| 9 | Technical debt | % time invested in technical debt reduction and remediation | |
| 10 | Architectural compliance | Number or % of data interfaces aligned versus not aligned to unified architecture | |
| Revenue Uplift | 11 | $ revenue increased | $ amount or % impact on revenue arising from deployment |
Our goal is to define clear, measurable criteria for each objective. These will be stated as OKRs.
This is a workshop exercise, where everyone is expected to contribute. This is particularly important — it’s everyone’s opportunity to identify exactly what constitutes “success” in their mind. In some cases success is clear, but in others it can be an agreed-upon destination. For instance, “improve customer satisfaction” is an objective that can be achieved through different outcomes. This is the time to establish what those outcomes are.
By defining clear key results, we are making our strategy actionable. The key results become the basis for acceptance criteria in the development pipeline — automated, measurable tests that we can use to protect and align on customer value.
Step 1: Define OKRs
- Refine business objectives to ensure they state measurable outcomes. If the team cannot agree on a specific outcome that indicates what success looks like, you may need to adjust your objective.
- Trace objectives to quantitative, measurable outcomes. Use a system such as an ROI Map to stay focused on tangible outcomes for the business. While revenue does not have to be the success indicator, it is almost always a very strong indicator of success. You can use the relative amount of revenue as a simple way to prioritize your outcomes into a roadmap (below, in Step 2). In other words, the more revenue an outcome generates, the higher its priority.
- Define metrics-driven, observable key results for each objective. State each of the key results that will achieve the business objective. Make sure that each key result is grounded in an observable, quantifiable metric. Use the format “we will [objective] as measured by [key result]” to define your OKRs.
Step 2: Establish your roadmap
As you create a complete picture of your business objectives and key results, you will find different results will yield more impressive outcomes. For any given objective, you might have half a dozen key results — but one or two of those will likely “move the needle” more than the others.
Build your roadmap by prioritizing the most impactful key results. These higher priority results will drive early initiatives the team focuses on. It’s important that a clear priority is assigned to each key result, so the team is aligned on where to focus early efforts.
The following example shows how you can group your OKRs by function and priority:
| Objective | Function | Key result |
|---|---|---|
| Reduce the number of data errors in the system | Order management | P1 As measured by reducing the number of orders that cannot be fulfilled automatically to less than 1% of all orders in a given day |
| Data cleaning | P3 As measured by reducing the number of data quality errors reported to the support desk from 20 per day to no more than 1 per week |
By grouping outcomes by function, you build the basis of your roadmap. As your roadmap becomes more complete, you’ll see similar capabilities falling under the same function, or the same initiative. For example, “order management” might be one such grouping — and clearly represents the most impressive gains. From a roadmap that groups outcomes this way, it’s easy to see we should tackle order management first, and data cleaning later.
The use of the word “function” to categorize outcomes is intentional. It coincides with the business functions specified in chapter 1.4 Business capabilities & functions. Your roadmap and OKRs will inform your business capabilities and functions, and vice-versa. Neither are fixed in stone. As new discoveries are made, adjust them to accommodate new learnings, further refine objectives, and improve key results. You can use this template as a starting point to build your key results and roadmap.
Outputs
- OKRs. Quantitative results against which success is measured (e.g., “operating cost reduced by 50% as measured by month over month infrastructure cost”).
- Roadmap (prioritized functions). An initial set of actions and initiatives that will support the OKRs, ordered by most impactful first.
Templates
Next activity
Footnotes
-
Laura Hennifan, Kelly Main, What Is An OKR? Definition & Examples, Forbes Advisor, Jul 20, 2023. ↩